The level of overall economic activity
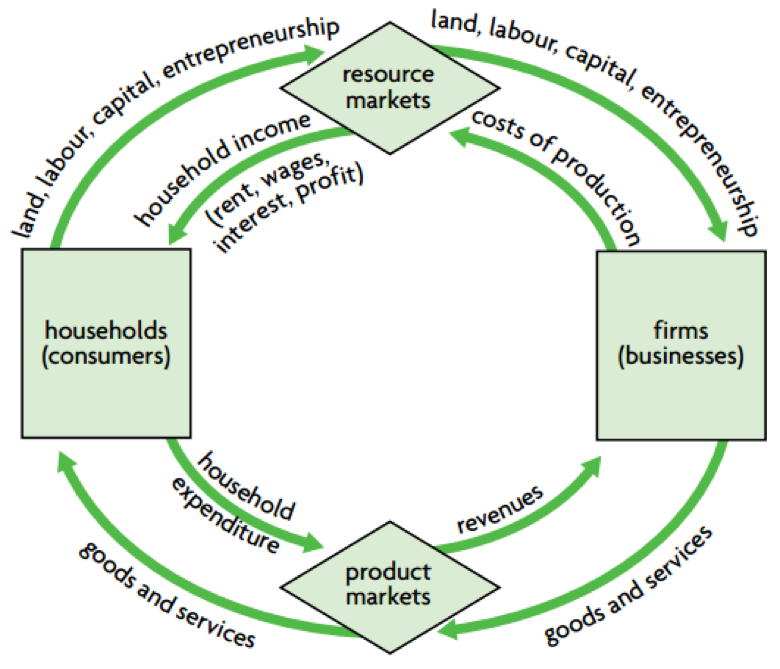
The circular flow of income model
A simple model of the economy showing flows of goods and services and factors of production between firms and households.
Two sectors model
It is assumed that the only decision-makers are households (or consumers) and firms (or businesses); Households and firms are linked together through two markets: product markets and resource markets.
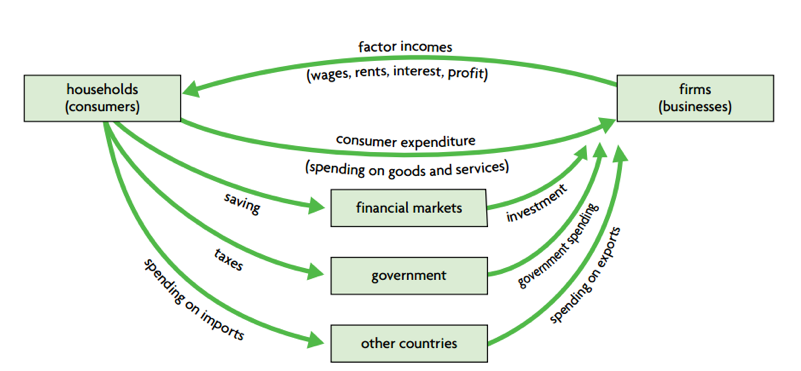
Four sectors model
Leakages from the circular flow of income (saving, taxes and imports) are matched by injections into the circular flow of income (investment, government spending and exports), In the real world, leakages and injections are unlikely to be equal, and this has important consequences for the size of the circular flow.
Measures of economic activity
Why
- assess an economy’s performance over time
- make comparisons of income and output performance with other economies
- establish a basis for making policies that will meet economic objectives.
How
- The expenditure approach: measures the total amount of spending to buy final goods and services in a country (usually within a year). Total spending is broken down into four components:
Consumption spending, abbreviated as C Investment spending, abbreviated as I Government spending, abbreviated as G Net exports (exports minus imports), abbreviated as X−M
- The income approach: adds up all income earned by the factors of production within a country over a time period (usually a year):
wages earned by labor, rent earned by land, interest earned by capital, profits earned by entrepreneurship.
When all factor incomes are added up, the result is national income(NI).
- The output approach: measures the value of each good and service produced in the economy over a particular time period (usually a year) and then sums them up to obtain the total value of output produced.
The output approach calculates the value of output by economic sector, such as agriculture, manufacturing, transport, banking, etc.
This approach provides us with the opportunity to study the performance of each individual sector and to make comparisons of performance across sectors.
Investment
It refers to spending by firms or the government on capital goods and on construction.
The term ‘final’
It refers to goods and services ready for final use, and can be contrasted with intermediate goods and services, or those purchased as inputs for the production of final goods.
Gross domestic product or GDP
It is the total value of all final goods and services produced within a country over a time period (usually a year).
Gross national income or GNI
It is the total income received by the residents of a country, equal to the value of all final goods and services produced by the factors of production supplied by the country’s residents regardless where the factors are located.
GNI = GDP + income from abroad − income sent abroad = GDP + net income from abroad
Nominal GDP or GNI
It is measured in terms of current prices (at the time of measurement), which does not account for changes in prices.
Real GDP or real GNI
They are measures of economic activity that have eliminated the influence of changes in prices. When a variable is being compared over time, it is important to use real values.
GDP deflator
A price index that is commonly used to convert nominal GDP to real GDP.
GDP deflator = nominal GDP / Real GDP ×100
Total GDP/GNP and GDP/GNP per capita
Total measures of the value of output and income (such as GDP and GNI), provide a summary statement of the overall size of an economy.
Per capita figures are useful as a summary measure of the standard of living in a country, because they provide an indication of how much of total output in the economy corresponds to each person in the population on average.
Evaluation of GDP/GNI
- GDP and GNI do not include non-marketed output (one’s own works) .
- GDP and GNI do not include output sold in underground (parallel) markets (unrecorded).
- GDP and GNI do not take into account quality improvements in goods and services.
- GDP and GNI do not account for the value of negative externalities, such as pollution, toxic wastes and other undesirable by-products of production.
- GDP and GNI do not account for quality of life factors (crime rate, a sense of security).
Green GDP
Ut is GDP that accounts for the value of resource and environmental destruction.
Economic growth
a percentage change in real GDP (or real GNI) over a specified period of time.
Business cycle
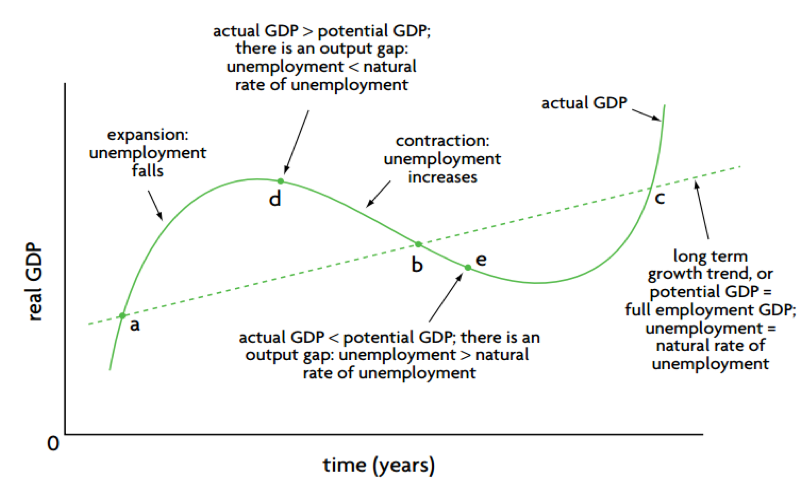
Fluctuations in the growth of real output, consisting of alternating periods of expansion (increasing real output) and contraction (decreasing real output), are called business cycles, or economic fluctuations.
- Expansion: positive growth in real GDP
- Peak: the cycle’s maximum real GDP; the end of the expansion
- Contraction: falling real GDP
- Trough: the cycle’s minimum level of GDP; the end of the contraction
Output gap (GDP gap)
- GDP fluctuates around full employment GDP
- When the economy’s actual GDP is at points such as a, b and c, actual GDP is equal to potential GDP, and the economy is achieving full employment, where unemployment is equal to the natural rate of unemployment.
- When the economy’s actual GDP is greater than potential GDP, such as at point d, there is an output gap, and unemployment falls to less than the natural rate.
Why study business cycle
- Reducing the intensity of expansions and contractions: this is aimed at making output gaps as small as possible. This would lessen the problems of rising price levels in expansions and unemployment in contractions.
- Increasing the steepness of the line representing potential output (the dotted line in Figure (b), by achieving more rapid economic growth over long periods of time.


No Comments